A Mathematics Geneaology Project Visualizer
The Mathematics Geneaology Project (MGP) is a publicly searchable database that records advisor-advisee relations between mathematicians. Their website is interesting, particularly if you're interested in the history of mathematics. Unfortunately, their website is also mostly text-based; there isn't a way to visualize the relationships between large groups of people.
I've created a tool that produces a directed graph displaying the advisor-advisee relations stored in the MGP database. I created this tool in 2012 in order to learn about how to process data from the web using python.
Example Output
After reading the steps below, you should be able to produce a picture like the one below.
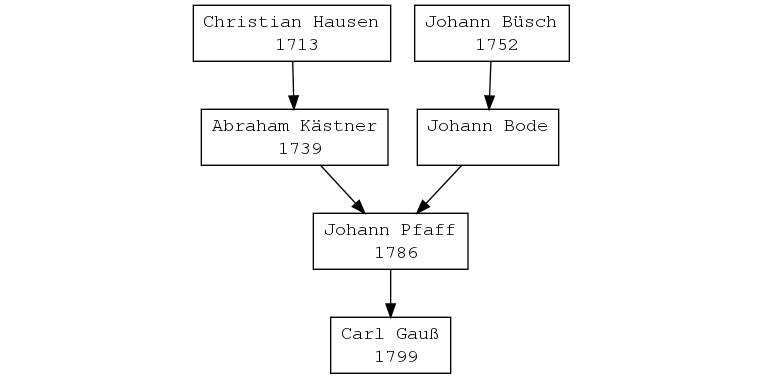
Naturally, the real purpose of the tool is to make much bigger graphs than this!
Download
You will need the following:
-
A copy of my python script which you can download here.
-
An installation of graphviz (this program takes care of the actual graph drawing).
-
Basic knowledge of the command line.
On an Ubuntu machine, these dependencies (graphviz and requests)
can be installed via:
$ sudo apt install virtualenv graphviz
$ virtualenv venv
$ venv/bin/activate
(venv) $ pip install requirements.txt
Usage Example
The easiest way to learn how to use this tool is by way of an
example. Place the mgptree script in a convenient folder (the
program generates a number of files). Change the permissions on the
script so that you can execute it.
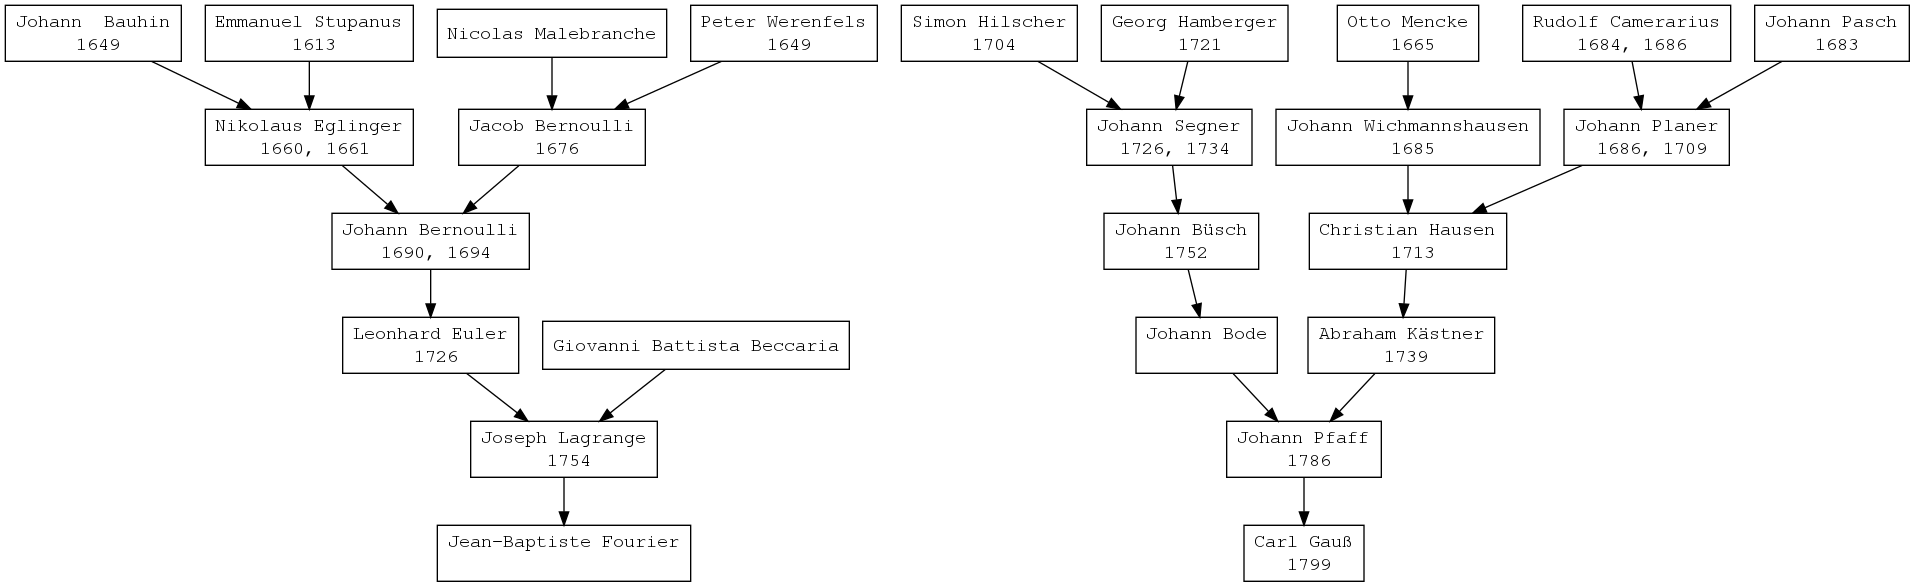
Let's say we want to generate a tree for Gauß and Fourier, going back 5 generations. The first step is to prepare a file of names for our search:
So, we create a unicode text file:
Gauß, Carl, Friedrich
Fourier, Jean-Baptiste, Joseph
I'll call the file gf.txt. Now we need to get some data from the
web. We do this as follows:
(venv) $ python mgptree.py -g 5 -s -i gf.txt -o gf.mgp
Saved 25 records to file gf.mgp.
The -s option indicates we want to "scrape" data from the MGP
website. The -g option indicates how many generations backward we
want to search. The -i denotes our input file, the -o gf.mgp
indicates that we want to save our results in a database named
gf.mgp.
Now we need to graph the data, so we type the following:
(venv) $ python mgptree.py -p -i gf.mgp -o gf.dot
(venv) $ dot -Tpng gf.dot -o gf.png
In the first line, the -p indicates we are now in "plotting mode"
where we want to convert the input database gf.mgp to a textual
format, which we'll save as gf.dot. The next line hands the textual
data to the graphviz program dot, which converts it to a PNG image
file named gf.png. (Many other file formats are available.)
Creating the intermediate database gf.mgp allows us to work with the
data offline, without having to query the web while we are figuring
out how we want to plot the data. For example, suppose we only want
to present two generations of the data we just downloaded. Then we'd
type
(venv) $ python mgptree.py -p -g2 -i gf.mgp -o gf_tiny.dot
(venv) $ dot -Tpng gf_tiny.dot -o gf_tiny.png
and we wouldn't have to retrieve any information from the web. The
result, gf_tiny.png looks like this:
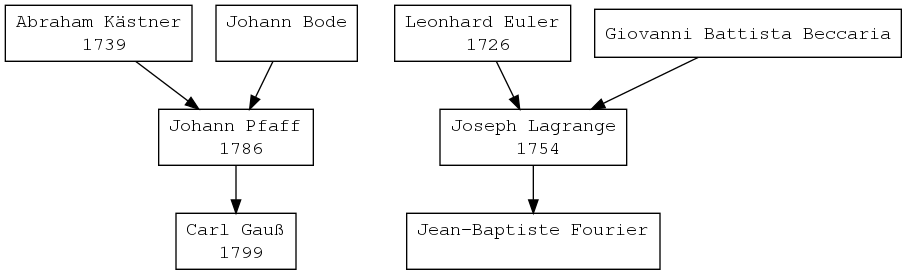
This feature can be pretty useful if you're trying to work with very large sets of data and don't know how much information you want to present.
Usage Tips
-
The Math Geneaology Project has some "holes" in its data. This seems to be particularly true for mathematicians who didn't get their degree in Europe or the US. If you or your advisor aren't listed, add your data to their website here to help fill in the gaps!
-
The number of requests to the MGP's database can grow to be quite large if you search back 10 or more generations. In particular, it's probably not a good idea to try to generate a tree for a large number of people and many generations.
-
Accurately matching name data isn't easy. For example, the mathematician Felix Klein is really named Christian Felix Klein. If your searches don't succeed, check to make sure you've got your name data right. This is particularly true for names with accents and umlauts.
Making Pretty Graphs
Because my script produces an intermediate .dot file, it is possible
for you to edit that file to add additional information or decorations
to the graph. Don't like the font I chose? Change the font=Courier
entry in the .dot file. Want to adjust a few nodes so that
significant mathematicians have special node colors? Search for their
names in the .dot file, then add the metadata
color=[your color here] to their nodes. The documentation for
graphviz is very useful for tasks like this.